


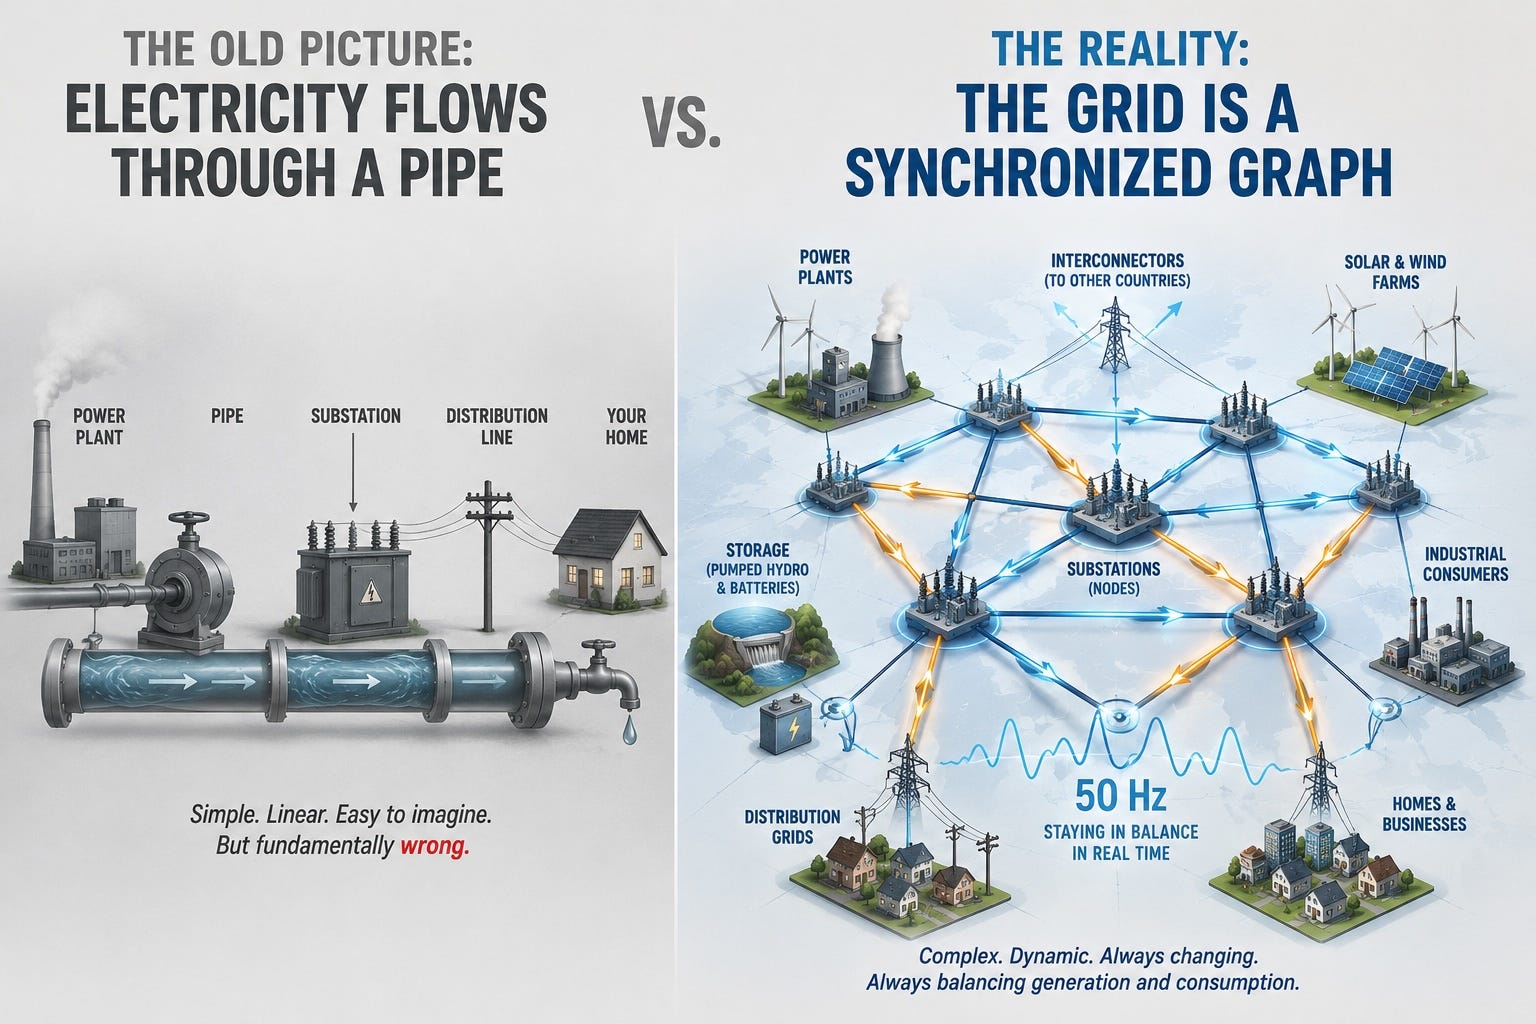
Figure 1: The old picture says power flows through a pipe. The real grid is a synchronized graph that must stay balanced in real time.
In the first part, we killed one comfortable idea: electricity is not water.

Now we can kill the next one.
The power grid is often imagined as a large water system. Somewhere far away there is a power plant, like a pump. Long power lines carry electricity, like pipes. The wires reach a city, then a street, then a house, and when someone opens the “tap” by switching on a device, electricity flows from the power plant into the socket.
It is simple. It is visual. It feels intuitive.
And it is almost the worst possible picture if you want to understand the real grid.
The grid is not a pipe where energy sits inside wires waiting to be consumed by devices. A power plant does not fill transmission lines with electrons and send them to your laptop, fridge, or washing machine. The real grid is a synchronized electromagnetic system. It works in real time. It oscillates. It has a frequency. It connects generators, consumers, transformers, substations, transmission lines, distribution grids, storage systems, and control centers into one huge machine.
And this machine has one brutal rule: generation and consumption must stay balanced all the time.
Consumers constantly change their behavior. Someone starts an industrial motor. A train accelerates. A factory begins a shift. A city wakes up in the morning. A cloud moves over a solar park. Wind generation rises or drops. A power plant ramps up, ramps down, or disconnects. Nothing is static, and still the whole system must remain synchronized.
In continental Europe, this synchronization is visible through the 50 Hz grid frequency. APG describes grid frequency as the measure of balance between electricity supply and demand, and one of its core tasks is to keep the system close to 50 Hz continuously. Austrian Power Grid
So no, the grid is not a pipe.
It is closer to a living technical machine whose operating state changes all the time. It is measured, switched, protected, transformed, corrected, and balanced continuously. Not because engineers enjoy complexity, but because the system would not work otherwise.
In this post we will discuss a better model for understanding the grid. We will stop looking at the fake “power plant to socket” diagram and rebuild the picture from the center outward. We will start with the high-voltage transmission grid, then attach substations, generators, storage systems, distribution grids, and consumers around it. After that, we will inspect a real slice of the Austrian grid and see how these abstract ideas appear in real infrastructure.
Because once we stop seeing the grid as a pipe, we can finally start seeing it as a graph.
The old diagram is already misleading
Most explanations of the grid start with a power plant.
The diagram usually looks like this:
Power plant. Transmission line. Substation. Distribution line. House. Socket.
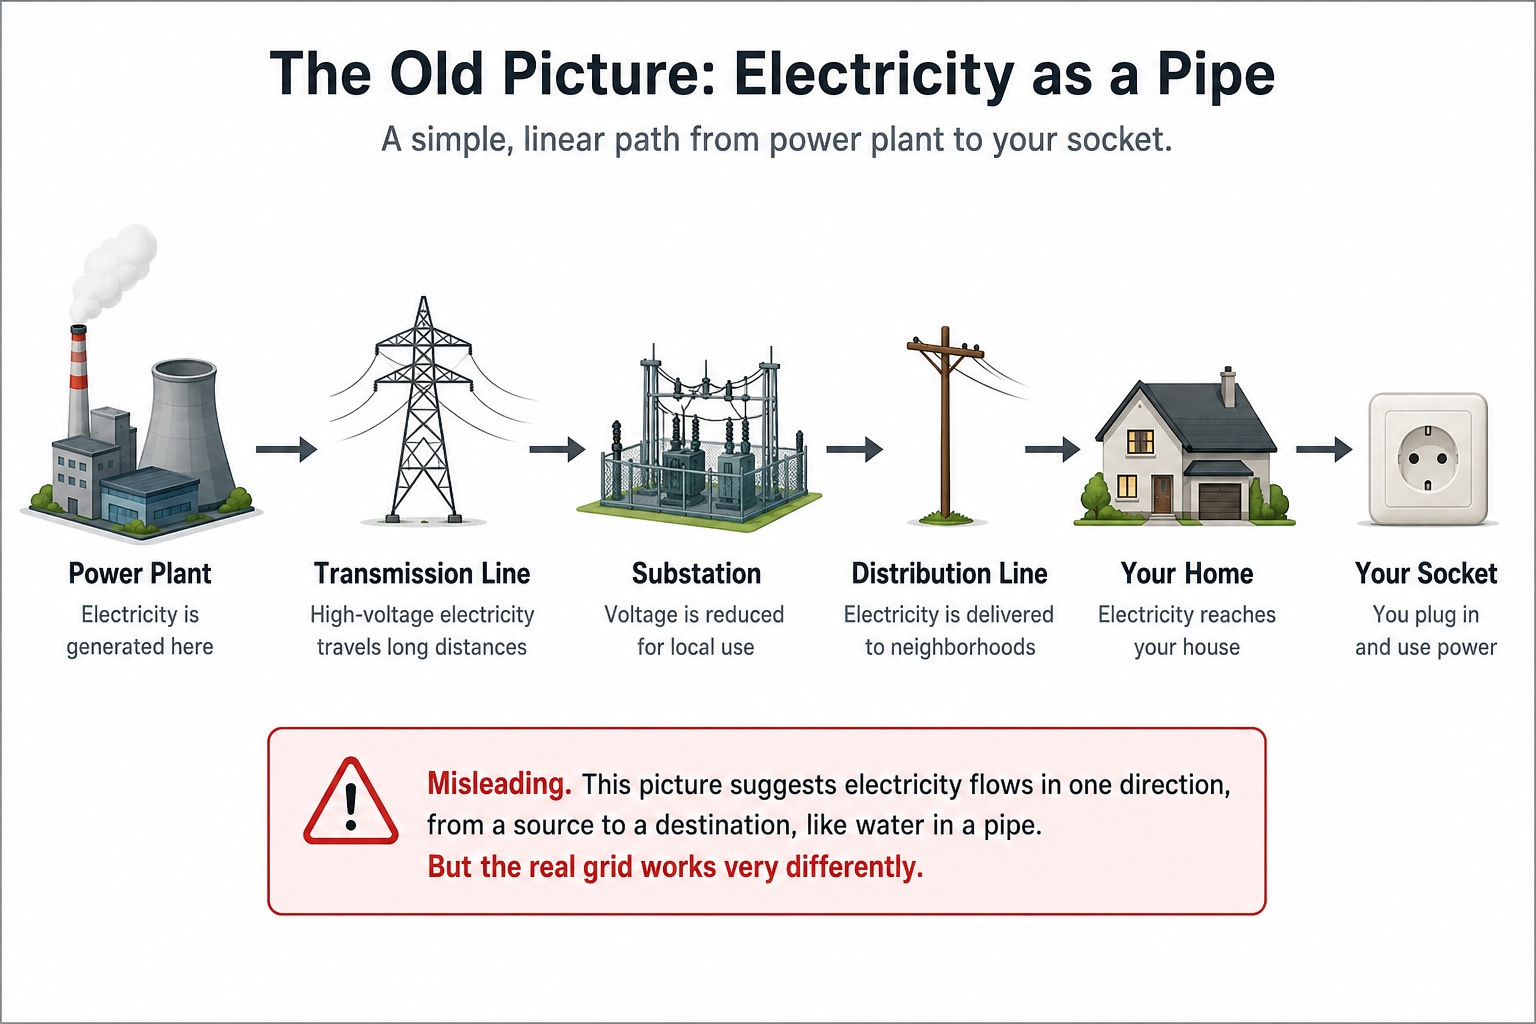
Figure 2: This picture is easy to understand, but it already teaches the wrong architecture.
At first sight, this seems reasonable because electricity is generated somewhere and consumed somewhere else. But the moment we draw the system this way, we accidentally teach the reader the wrong architecture.
We make it look like electricity has a source, a route, and a destination. We make it look like a delivery system. A factory produces a product, a road transports it, and a customer receives it.
But the electrical grid is not a delivery route.
A generator does not produce a private stream of electricity for one city. A house does not receive electrons that started their journey at one specific power plant. A transmission line is not a pipe with a fixed direction. The grid is a shared synchronized system. Generators inject power into this system. Consumers withdraw power from it. Storage can do both. Power flows change depending on the current physical state of the network.
That is why starting with a power plant is already dangerous. It keeps us inside the pipe model.
A better starting point is the network itself. Not the generator, not the socket, but the grid.
The grid is a graph, not a chain
For a software developer, the better mental model is not a pipe. It is a graph.
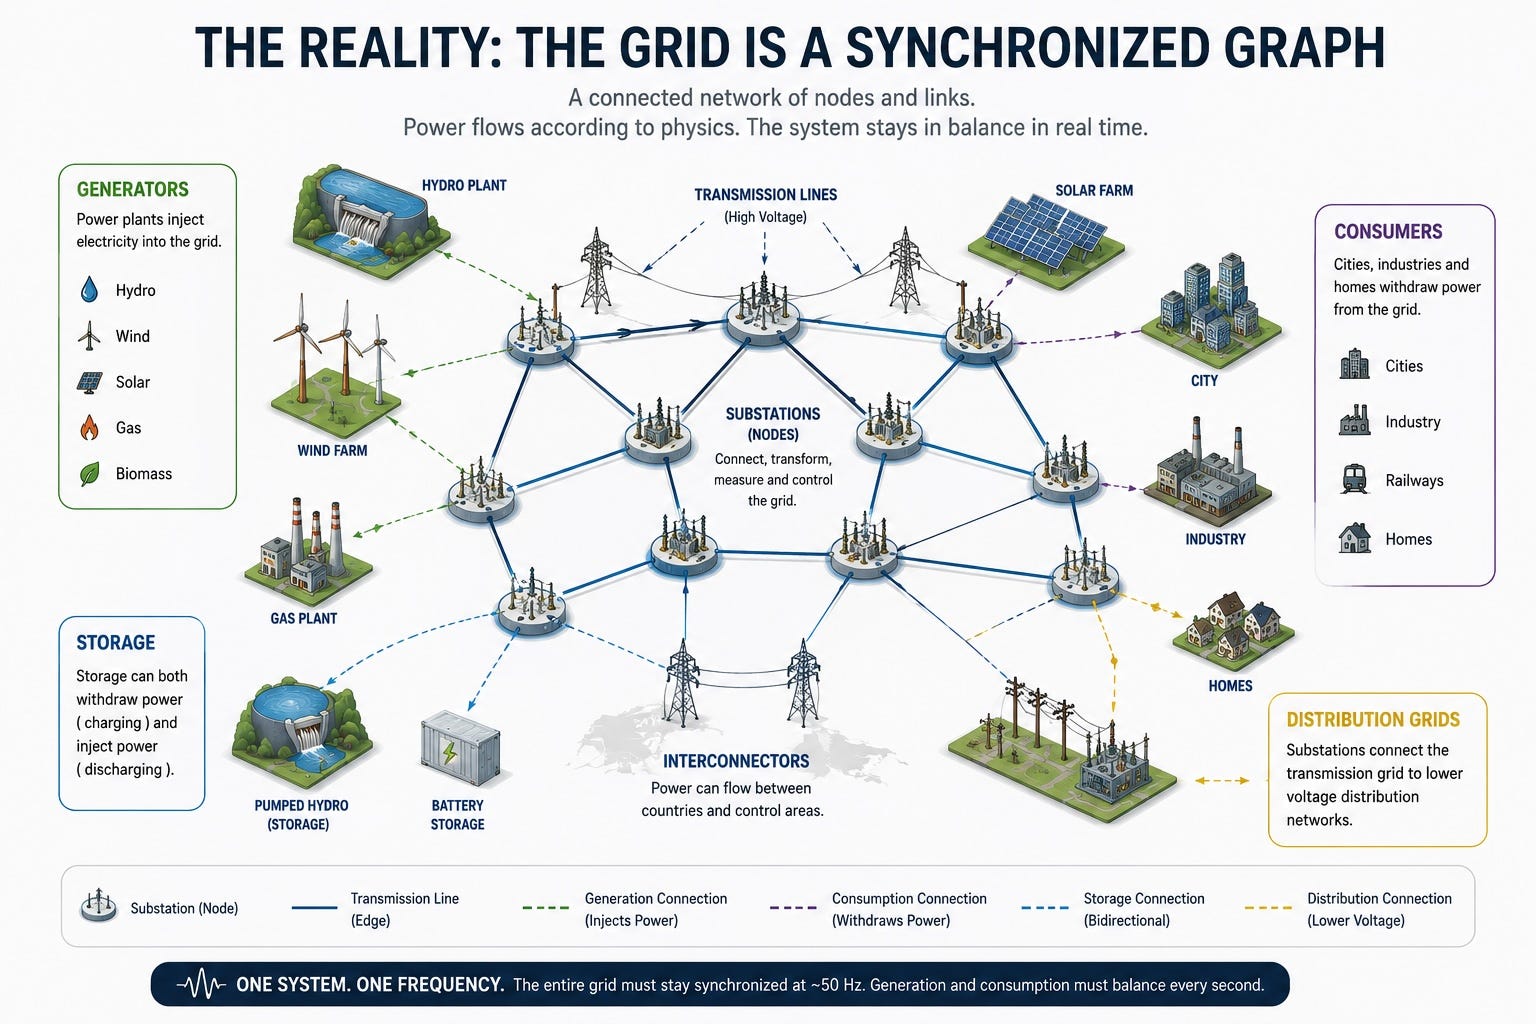
Figure 3: A better model: high-voltage lines form the backbone, substations are nodes, and generation, storage, distribution, and consumers attach to the graph.
Transmission lines are edges. Substations are nodes. Generators, storage systems, distribution grids, industrial consumers, cities, and interconnectors are attached to this graph at different points.
But we need to be careful here, because this analogy can also become stupid if we push it too far.
The grid is not the internet. Power does not move like packets. There is no router that says, “send this megawatt through line A and this other megawatt through line B.” Power flows according to physics. It depends on voltage, impedance, phase angle, topology, and the current state of the synchronized system.
Still, the graph model is extremely useful because it breaks the one-way chain illusion.
In a chain, you start at one end and walk to the other end. In a graph, you first ask what is connected to what. That is exactly how we should look at the grid.
The high-voltage network is the backbone. Substations connect parts of the backbone to each other and to lower voltage levels. Generators inject power at some nodes. Consumers withdraw power through other nodes. Storage systems can either withdraw or inject, depending on the operating mode. Interconnectors connect countries and control areas. Protection systems watch the graph and disconnect faulty parts when something goes wrong.
This is already a much better picture.
The grid is not a road from a power plant to your socket. It is a synchronized graph whose state must be kept inside safe limits.
Why we start with the high-voltage grid
If we start with a house, the grid looks like a local supply problem.
If we start with a power plant, the grid looks like a delivery problem.
But if we start with the high-voltage grid, the architecture becomes visible.
The high-voltage grid is the strong skeleton of the system. It connects regions, countries, large generation sites, large consumption areas, and lower-voltage networks. In Austria, APG manages the transmission grid at 110 kV, 220 kV, and 380 kV. These voltage levels are used to transport electricity efficiently over long distances and to connect large parts of the country into one operating system. Austrian Power Grid
This is where the pipe analogy starts to completely fall apart.
A high-voltage line is not just a long cable from one plant to one city. It is part of a larger network. Depending on generation, consumption, outages, maintenance, weather, and market schedules, power flows can change. A line can carry more or less power. A region can import or export. A storage plant can consume power in pumping mode and produce power in turbine mode. The same physical infrastructure participates in many different operating situations.
At the European scale, this becomes even more obvious. ENTSO-E (European Network of Transmission System Operators for Electricity) provides a transmission system map showing power plants, converters, substations, and high-voltage cables and lines operated by European transmission system operators. The map is useful for seeing the scale and density of the interconnected transmission network, but it should not be read as exact geography because ENTSO-E notes that network elements are not placed at their precise geographic positions. ENTSO-E Transmission System Map
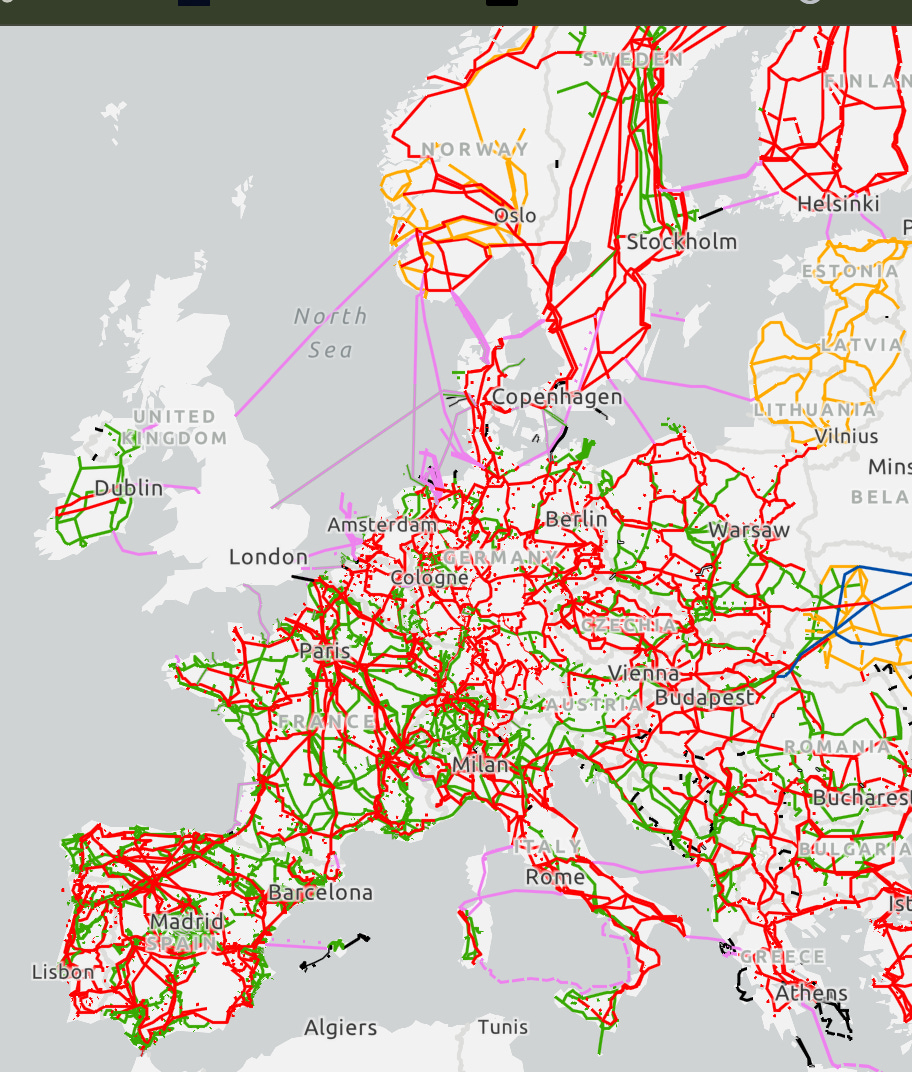
Figure 4: Even as a schematic, the European transmission system looks less like a pipe and more like a continental graph. Source: ENTSO-E.
That map is overwhelming, and that is exactly the point.
The European grid is not a simple line from source to load. It is a continental machine. So instead of trying to understand the whole map at once, we can zoom into one country and then into one real grid node.
Austria is a good place to do this because the APG grid gives us a concrete high-voltage backbone, and the Austrian grid does not stop at the border. It is part of the wider European synchronous system.
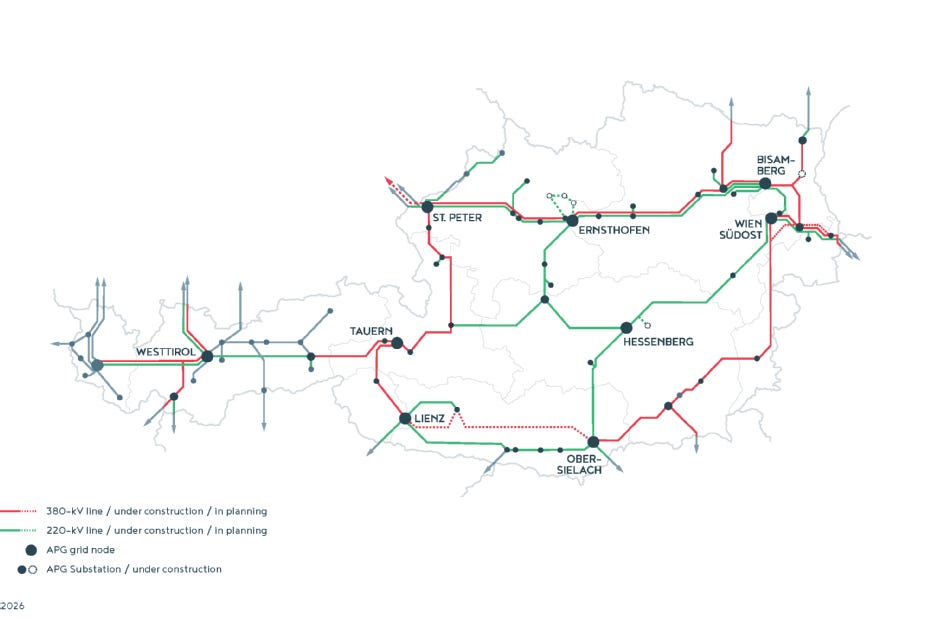
Figure 5: Austria’s transmission grid gives us a real backbone to inspect, with 110 kV, 220 kV, and 380 kV layers connected through substations. Source: Austrian Power Grid.
Substations are the nodes where the graph becomes real
Once we think in graphs, substations become much more interesting.
A substation is not just “the place where voltage goes down.” That is the school version. It is not completely wrong, but it is far too small.
A substation is a grid node.
It is a place where lines meet, voltage levels connect, transformers change voltage, breakers can connect or disconnect parts of the system, measurements are collected, faults are detected, and operators can change the topology of the network.
In graph language, a substation is where the abstract edge-and-node model becomes physical.
A transmission line arrives. Another line leaves. A transformer connects the 380 kV grid to the 220 kV grid or the 110 kV grid. A distribution network may be supplied from there. A power plant may be connected nearby. A breaker can disconnect a faulty line. Protection systems can isolate a damaged part of the network before the fault spreads further.
That is why substations are not secondary details. They are one of the main reasons the grid can be operated at all.
But in this article, we will not yet open the substation and inspect every component. Busbars, bays, breakers, disconnectors, transformers, protection relays, SCADA, and IEC 61850 deserve their own article. For now, we need only one idea:
A substation is a controllable node of the grid graph.
A real example: Pongau substation
Now let us stop speaking only in abstractions.
APG’s (Austrian Power Grid) Pongau substation is a good real-world example because it shows how much can happen at one node of the grid.
Pongau is a region in the Austrian federal state of Salzburg, south of the city of Salzburg and close to the Alpine hydropower and pumped-storage area around Kaprun and Tauern. You do not need to know Austrian geography to follow the argument. The only important point is that this node sits between several relevant grid directions.
APG describes Pongau as a newly constructed 380/220/110/30 kV substation in St. Johann im Pongau, commissioned in the first quarter of 2025 as part of the Salzburg line. The substation includes 380 kV GIS switchgear, two 380/220 kV transformers that connect the 380 kV and 220 kV grids, and two 380/110 kV transformers that connect the 380 kV and 110 kV grids. Austrian Power Grid, Pongau Substation
Before looking at the substation structure, we should first place it on the map. If you do not know Austrian geography, “Pongau” is just a name. The important thing is that it sits in a region where several relevant directions meet: toward Salzburg, toward Kaprun and Tauern, toward Weißenbach, and toward the regional Salzburg grid.
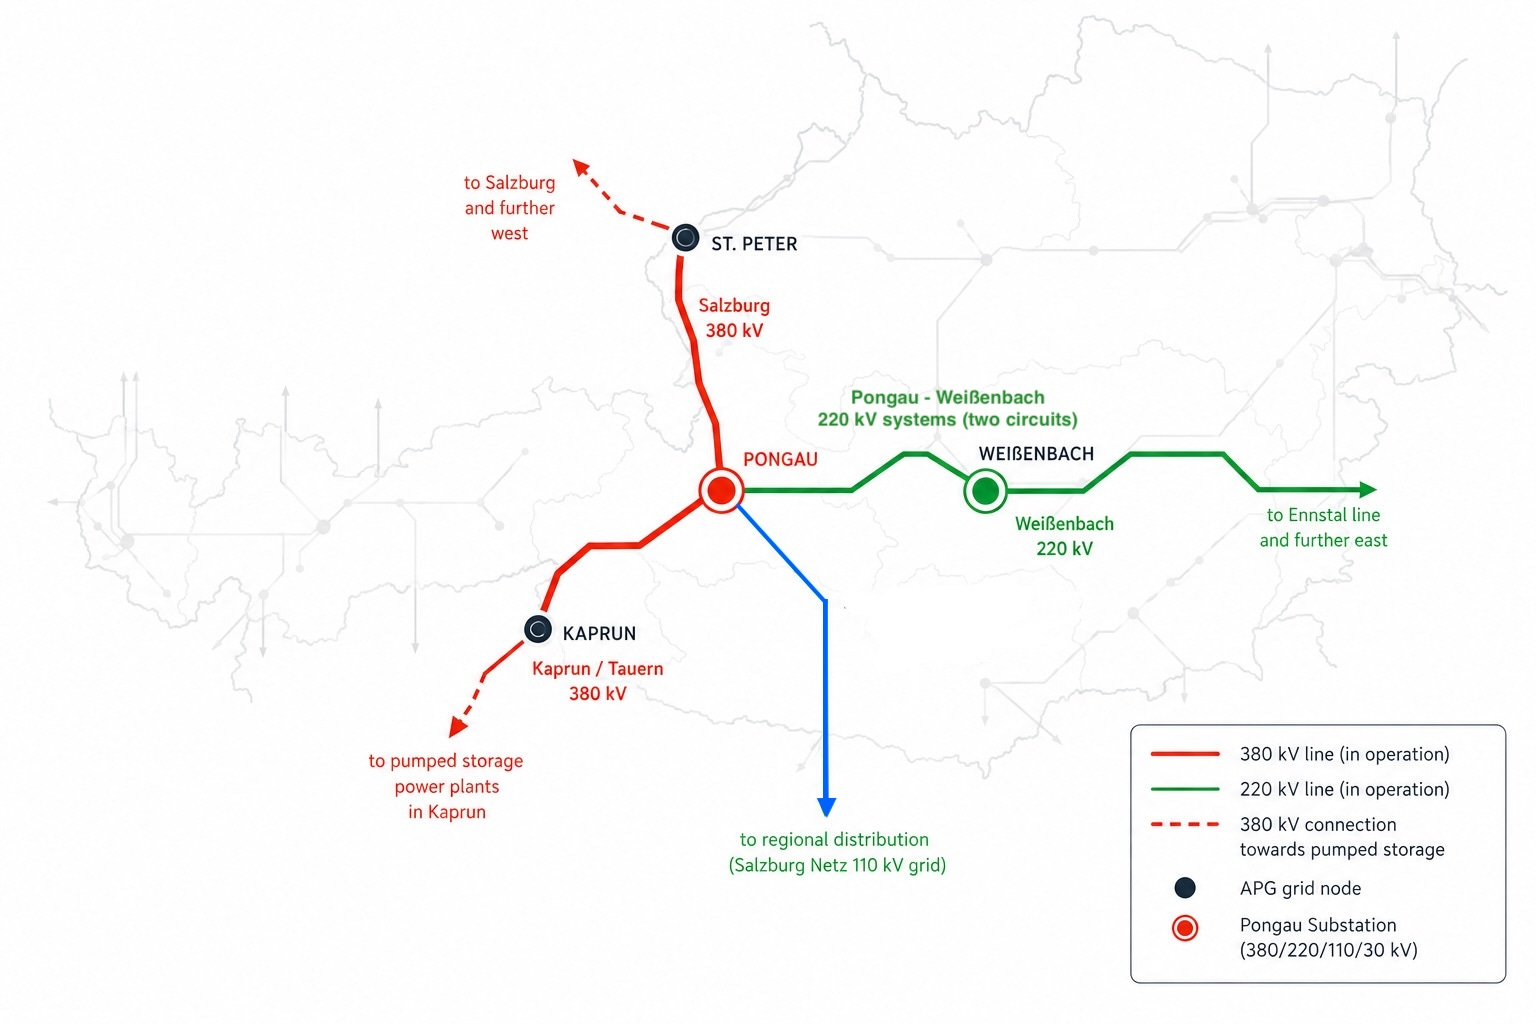
Figure 6: Pongau on the Austrian transmission map.
Pongau is not just a transformer in a field. It is a grid node where different voltage levels, transmission directions, pumped-storage connections, and regional distribution meet.
This is not a transformer in a field.
At this one node, different voltage levels meet. A 380 kV system from the Salzburg line is integrated. A connection continues toward Kaprun and Tauern. The 220 kV side connects toward Weißenbach. The 110 kV side connects to Salzburg Netz and the regional distribution grid. The 30 kV level is local or auxiliary in this simplified view, not a major transmission corridor.
This is exactly why the graph model is useful.
If we tried to explain Pongau with the pipe analogy, we would ask the wrong question: where does the electricity come from, and where does it go?
But the better question is: what does this node connect?
It connects voltage levels. It connects transmission paths. It connects regional distribution. It connects pumped storage. It strengthens supply reliability. It becomes part of the high-voltage architecture that allows the Austrian grid to operate as a system rather than as isolated local supply islands.
A substation like Pongau is not a passive object on the way from generator to consumer. It is part of the architecture that makes the whole system usable.
Generators do not “send electricity to houses”
Now that we have the graph, we can attach generators to it.
A generator is any facility that injects electrical power into the grid. It can be a hydropower plant, a gas plant, a wind farm, a solar plant, a biomass plant, or another generation source.
But the important word is injects.
A generator does not choose one household and send energy to it. It pushes power into the synchronized system. That changes the state of the system, and the physical network determines how power flows.
This is why the simple sentence “this power plant supplies this city” is often misleading. It may be true in an administrative, regional, or approximate sense, but electrically the situation is more complex. A power plant is connected to a grid node. Consumers are connected to other grid nodes. The system balances the total injection and withdrawal through the whole network.
Not let’s look at Kaprun.
Kaprun is a small municipality in the Austrian Alps, in the federal state of Salzburg, but in the Austrian power system the name means much more than a tourist village near mountains and reservoirs. The Kaprun area is closely associated with hydropower and pumped-storage infrastructure. It sits near the Alpine water reservoirs and power plants that can turn stored water into electricity when the grid needs power, or consume electricity to pump water back uphill when storing energy makes sense.
That makes Kaprun perfect for this article. It shows why “generator” and “consumer” are not always fixed identities. VERBUND (Austria's leading electricity company and one of the largest producers of hydroelectricity in Europe) describes the Kaprun power plant group as a storage power plant system with turbine capacity and pumping capacity. Pumped storage is useful because it can generate electricity when water flows down through turbines, but it can also consume electricity when pumps move water back up into a higher reservoir.
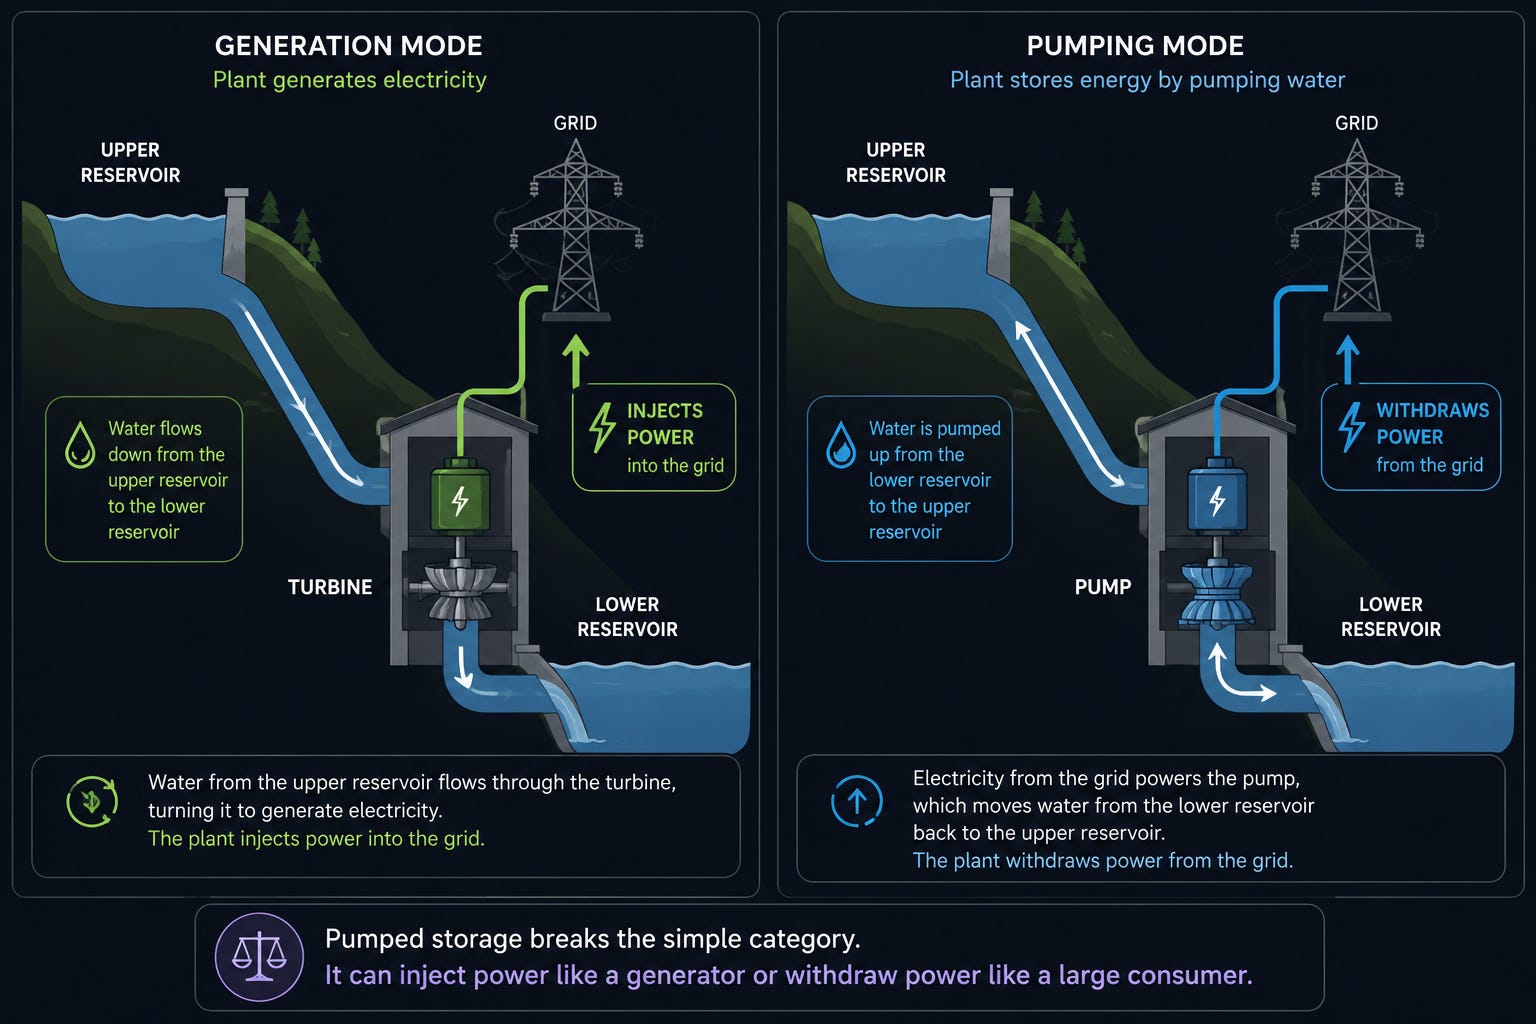
Figure 8: Pumped storage breaks the simple category. It can inject power like a generator or withdraw power like a large consumer.
This destroys another simple category.
A pumped-storage plant can behave like a generator. And it can behave like a consumer.
When the system needs power, it can inject power. When there is excess generation or when storage is economically and operationally useful, it can withdraw power and store energy as water at a higher elevation.
So even the terms “generator” and “consumer” are not fixed identities forever. They are roles a component can play in the current operating state of the grid.
Consumers are not the end of a pipe
Consumers also become clearer in the graph model.
A house is a consumer. A factory is a consumer. A railway system is a consumer. A city is a huge collection of consumers. A distribution grid can look like one large withdrawal point from the perspective of the transmission grid.
Most individual consumers are not connected directly to the high-voltage transmission grid. They are connected through lower-voltage distribution networks. Those distribution networks are then connected to the transmission grid through substations and transformers.
So when we zoom out to the transmission level, we should not imagine millions of tiny sockets attached directly to the 380 kV grid. We should imagine large withdrawal areas connected through distribution networks.
This is another reason the pipe picture fails.
The grid is not one pipe that becomes smaller and smaller until it reaches your phone charger. It is a layered electrical system. The high-voltage grid forms the backbone. Substations connect it to regional and local networks. Distribution grids bring power closer to consumers. And at each level, voltage, protection, switching, measurement, and operation matter.
The closer we move to individual homes, the more radial the system often becomes. But the transmission grid itself is designed more like a meshed backbone because important regions should not depend on one fragile path.
Redundancy: the graph should not break too easily
In graph theory, a bridge is an edge whose removal disconnects part of the graph.
That idea is useful for thinking about the transmission grid.
A fragile grid would have critical lines where one failure separates a whole region from the rest of the system. A stronger grid gives important regions more than one way to stay connected. Real grids are not perfectly bridge-free everywhere, but redundancy is one of the key design goals of transmission infrastructure.
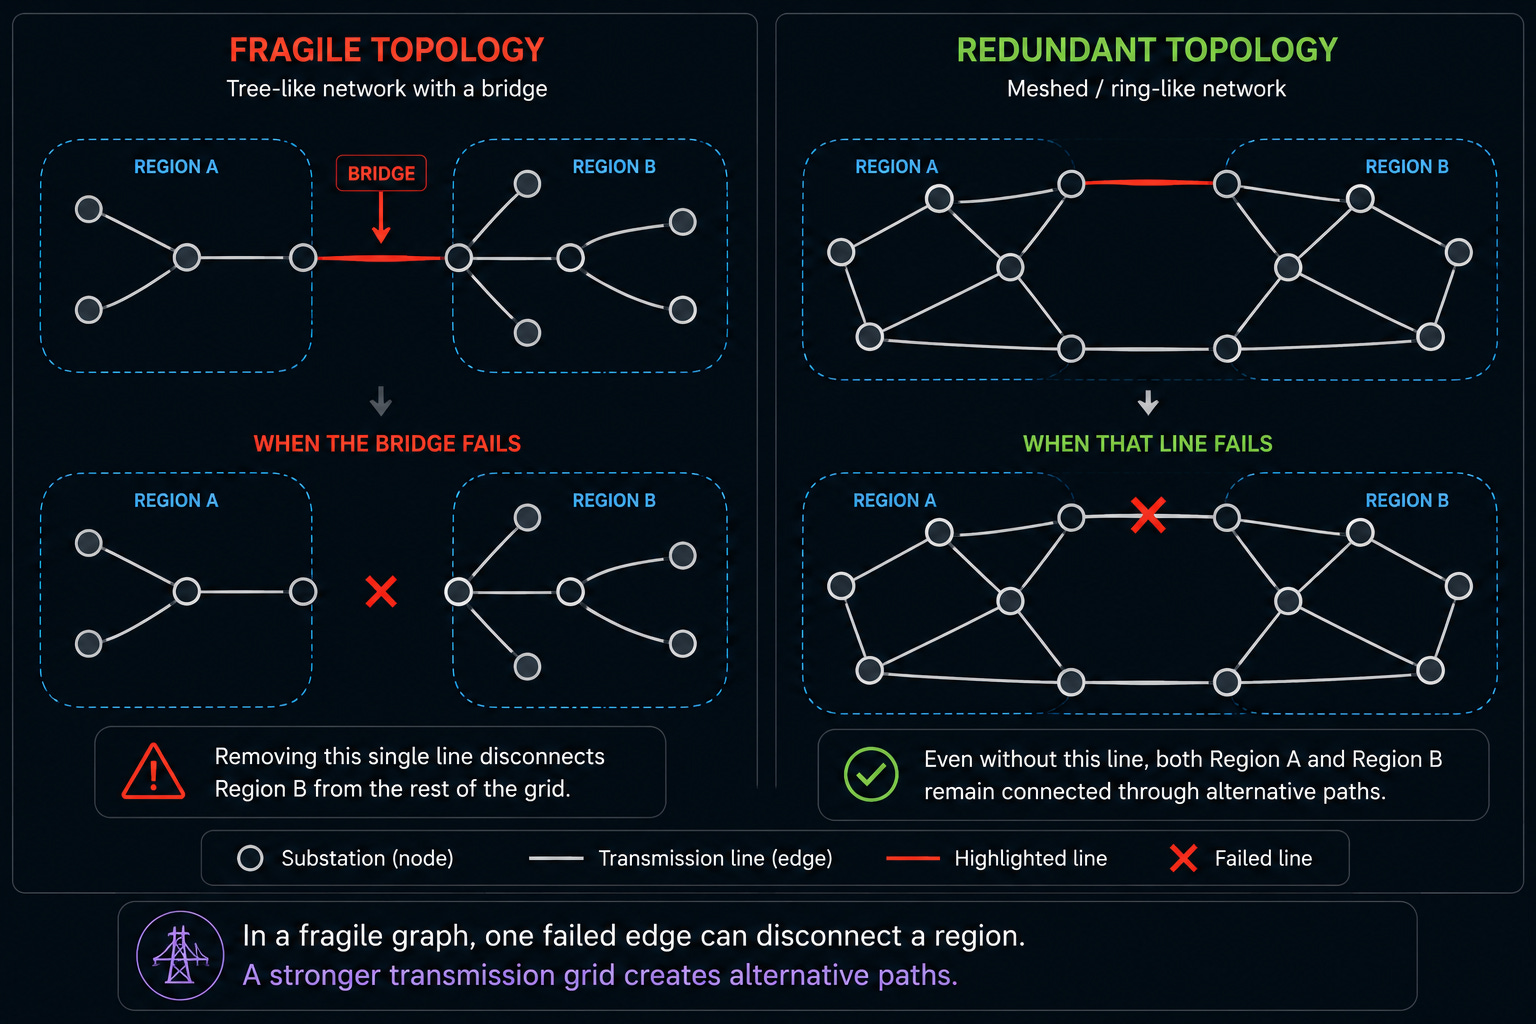
Figure 9: In a fragile graph, one failed edge can disconnect a region. A stronger transmission grid creates alternative paths.
Austria gives a good example here. APG describes the 380 kV Salzburg line as part of Austria’s extra-high-voltage ring, and says the ring structure allows power to flow to customers from either direction. The Salzburg line closed a gap in the western part of that ring and entered full operation in April 2025.
The same idea appears in southern Austria. APG’s Carinthia power grid area project plans a 380 kV connection between Obersielach and Lienz to close the 380 kV grid in southern Austria. APG explains that the 380 kV ring creates a redundant connection because important substations can be supplied from two sides.
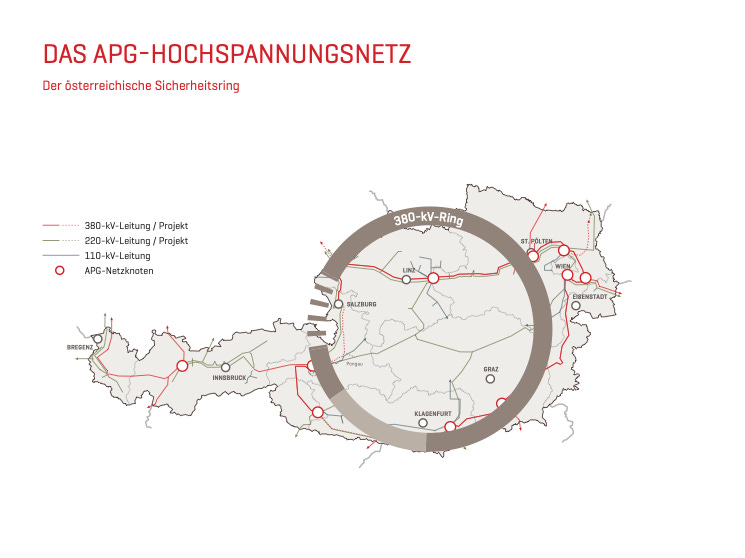
This is the graph model becoming real engineering.
We build redundancy because real systems fail. Lines are taken out for maintenance. Weather damages infrastructure. Equipment trips. Loads change. Generation patterns shift. If the grid were a simple tree, every important edge would become a potential disaster.
A meshed high-voltage grid gives operators more room to keep the system alive.
Again, we should not confuse this with the internet. The grid does not reroute power like packets. But topology matters. Connectivity matters. Alternative paths matter. A ring is not just a geometric shape. It is a way to reduce dependence on a single corridor.
So what is the grid?
At this point, we can rebuild the picture.
The grid is not a pipe. It is not a chain from power plant to socket. It is not a delivery system. It is a synchronized graph built from physical infrastructure.
High-voltage transmission lines form the backbone. Substations are the nodes where lines, transformers, voltage levels, distribution grids, generators, and storage systems connect. Generators inject power into the system. Consumers withdraw power from it. Pumped storage can do both. Redundancy helps the system survive outages and maintenance. Operators and protection systems keep the graph inside safe limits.
And all of this is part of a larger synchronized machine.
The most important idea is not that the grid has many components. The most important idea is that all these components participate in one continuously changing operating state.
Generation changes. Consumption changes. Storage changes mode. Power flows change. Lines become loaded or unloaded. Substations connect and disconnect parts of the graph. Protection systems wait for faults. Operators watch the system.
And through all of that, the grid must stay balanced.
The real goal: balance
The whole grid has one brutal rule: generation and consumption must stay balanced all the time.
But neither side is stable.
Consumers switch devices on and off. Factories start machines. Trains accelerate. Cities move through morning peaks and evening peaks. Wind farms produce more or less depending on the weather. Solar production changes with clouds and time of day. Power plants start, stop, ramp up, or reduce output. Pumped-storage plants can suddenly become large consumers or large generators.
And still, the system has to remain synchronized.
Across Austria, across neighboring countries, across the continental European grid, the machine has to keep its frequency close to 50 Hz. APG’s balancing information describes 50 Hz as the set point value in the Continental Europe synchronous area and explains that generation and consumption must stay in constant equilibrium. APG Balancing
That is the real goal of the grid.
Not simply to “send electricity” from power plants to houses.
The real goal is to continuously adapt generation, consumption, storage, topology, voltage, and power flows so the whole system remains stable.
This is why the pipe analogy is not only incomplete. It hides the most beautiful part of the system.
A pipe does not need synchronization. A pipe does not have frequency. A pipe does not react to every change in the whole continent. A pipe does not have to balance generation and consumption in real time.
The grid does.
And now that we can see the grid as a synchronized graph, the next question becomes much more interesting:
How is this machine operated?
In the next article, we will look at grid operation and see how all the components we discussed, transmission lines, substations, generators, consumers, storage systems, and control systems, are used to keep generation and consumption balanced in real time.
Sources
Austrian Power Grid: [Power Grid Austria]
Austrian Power Grid: [Pongau Substation]
Austrian Power Grid: [Salzburg Line]
Austrian Power Grid: [Carinthia Power Grid Area]
APG Market: [Balancing]
ENTSO-E: [Transmission System Map]
VERBUND: [Power plants and hydropower information]