


Previous part:

“The metasphere remains. But it is more wilderness than ever now. Black forests of unknown time and space. Sounds in the night. Lions. And tigers. And bears.” ― Dan Simmons, Hyperion
Where does software live in the grid?
It lives between, within and above.
For most of this series, I was looking at the physical world. Generators produce electricity, transformers change voltage, transmission lines connect regions, and substations switch and protect all of it. These things have weight, occupy space and can be found on a map.
But during my research I slowly realised that there is another world hiding inside this one.
Software lives inside protection relays and control-room servers. It lives between devices, companies and countries. It stretches above cables and transformers as measurements, alarms, schedules, forecasts, bids and models. Almost every hollow space that is not fulfilled by the physical world hides another piece of software.
And it does not only observe the industry. It moves it. Software opens breakers, reconstructs the state of the grid, predicts tomorrow’s demand, accepts bids, calculates prices, activates reserves and later calculates who owes money to whom because reality did not follow the plan.
For me, it looks like a huge augmented reality built on top of the grid. At some point it becomes difficult to decide which reality is primary. Electricity still follows physics, but more and more of what happens around it is decided, coordinated and recorded in software.
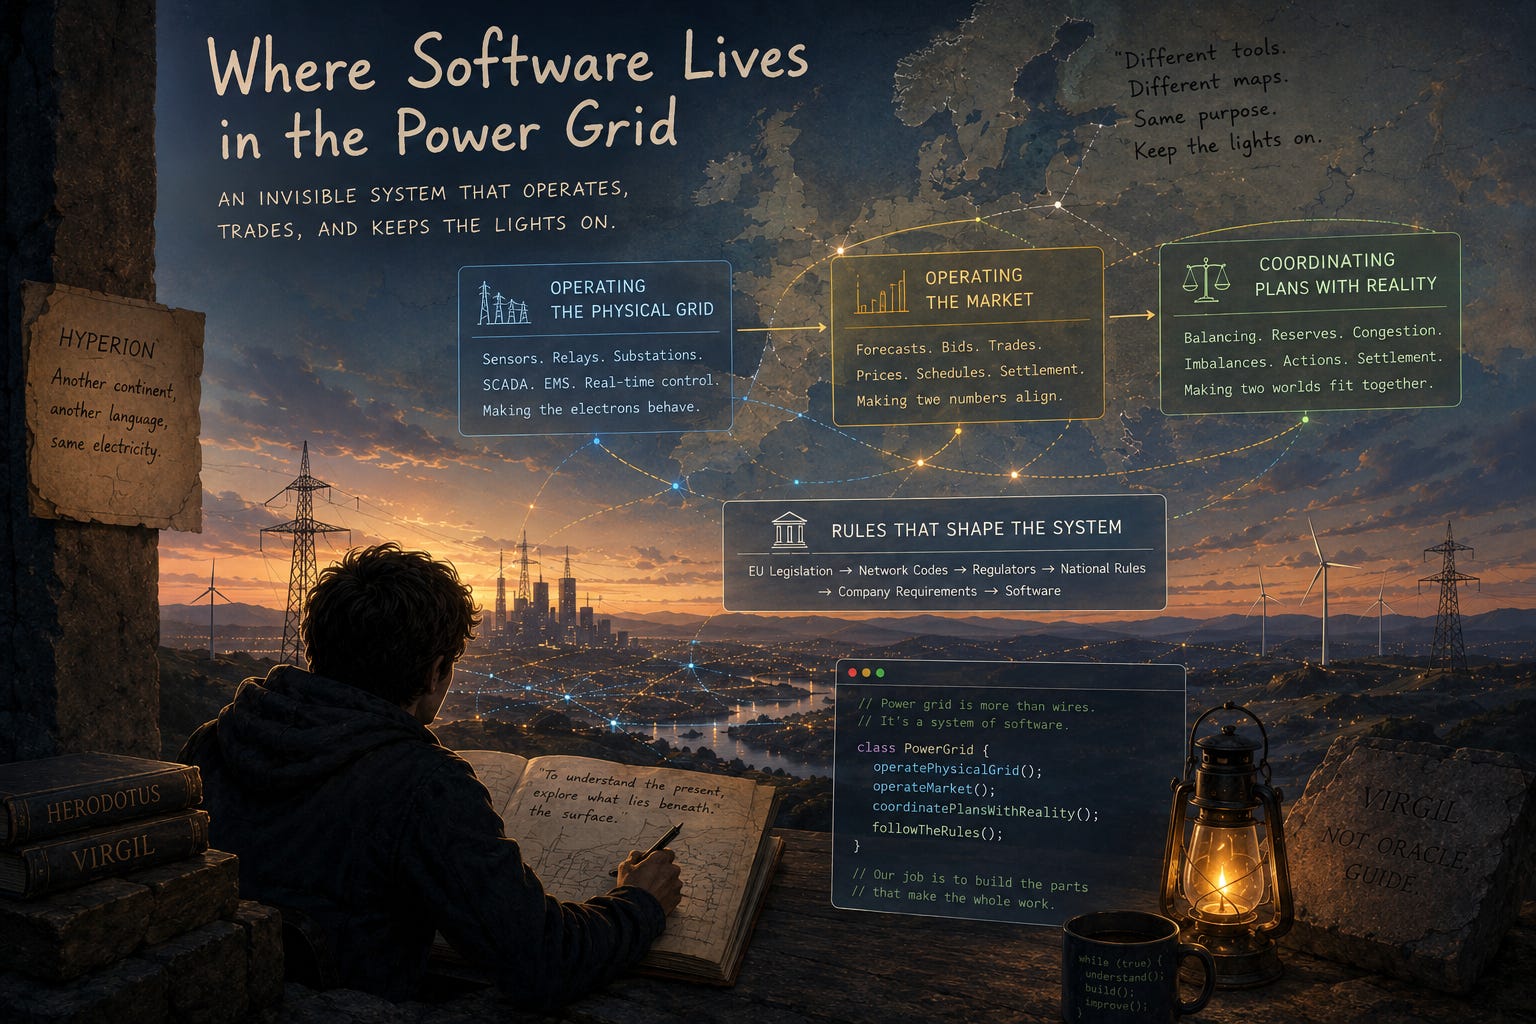
It felt like discovering another continent.
I do not want to pretend that I can produce its Google Map. What I can draw is closer to the maps of Herodotus, collected from documents, conversations, tools I met at work and stories from people who travelled further than I did. It will contain blank places and probably a few sea monsters, but it should still be enough to understand where we are.
And AI, for better or worse, has been my Virgil during this journey.
In this post we will discuss three large software worlds: the software that operates the physical grid, the software that operates the electricity market, and the software that connects financial plans with physical reality.
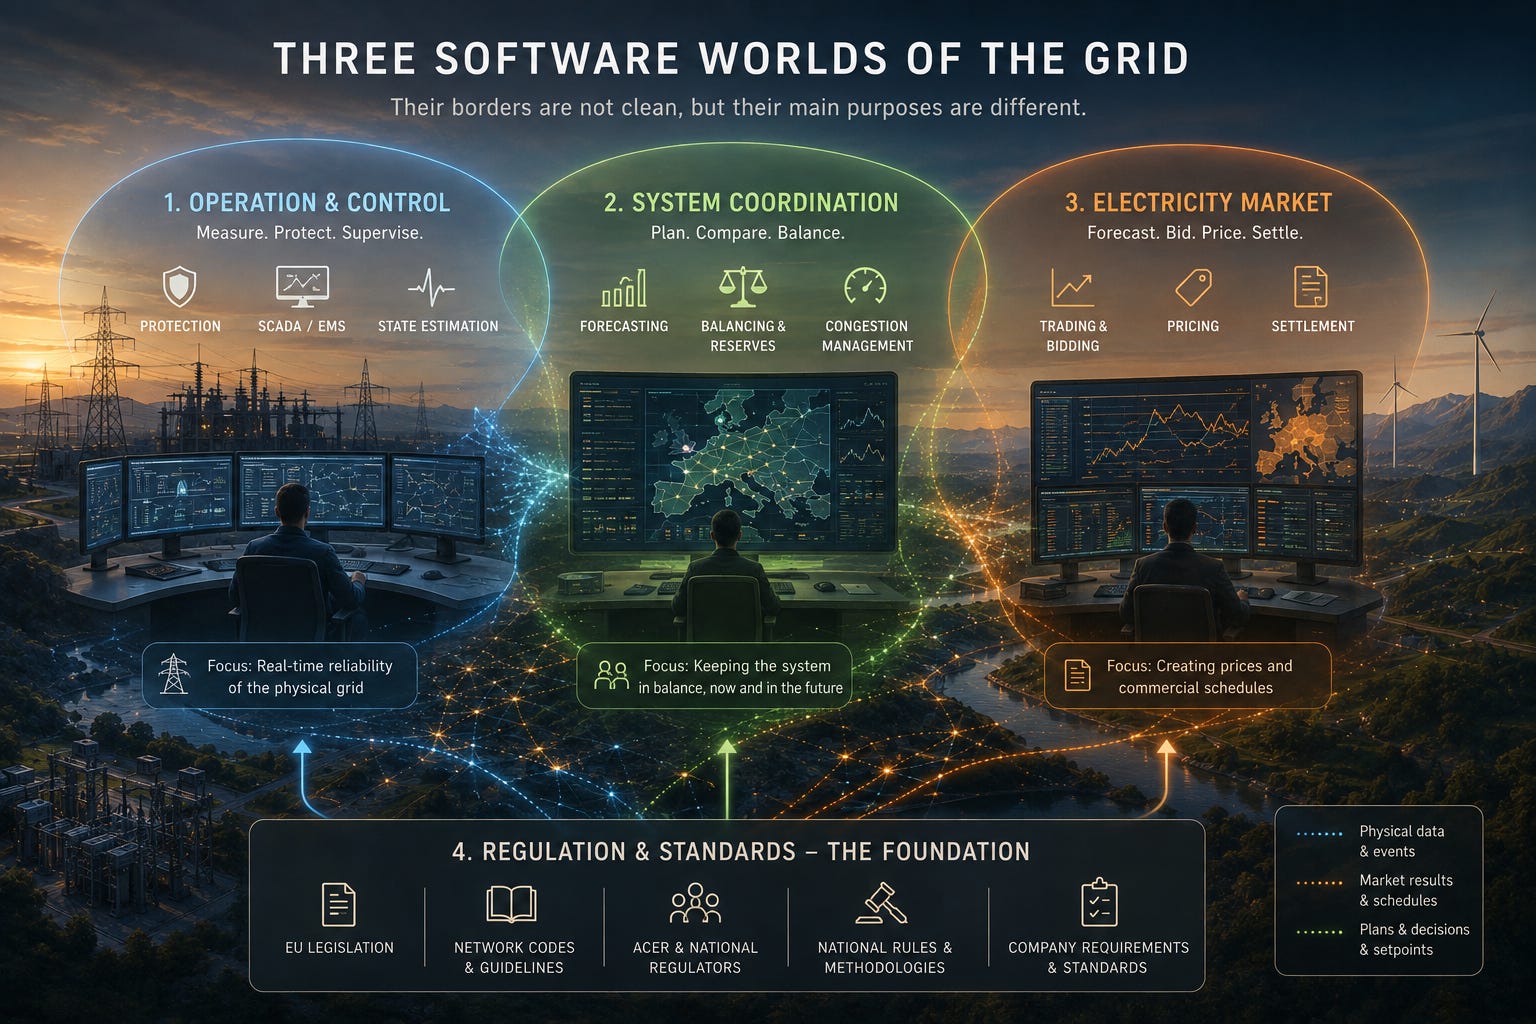
Figure 1. Three software worlds of the grid. Their borders are not clean, but their main purposes are different.
Software that operates the physical grid
This is the software closest to copper, steel and electromagnetic fields.
A breaker does not know that it is called Q0. A current transformer does not produce a neat object with a timestamp and a quality flag. The physical world gives us voltage, current, heat, motion and consequences. Software turns them into information that people and other systems can use.
The first computers we meet are Intelligent Electronic Devices, usually shortened to IEDs. This family includes protection relays, bay controllers, merging units and meters.
A protection relay watches electrical quantities and reacts when they indicate a fault. It may detect overcurrent, an abnormal frequency or a fault inside a transformer and send a trip command before a remote operator could even understand what happened.
A bay controller supervises breakers, disconnectors and earthing switches around one part of a substation. A merging unit digitises current and voltage measurements. A meter measures energy or power for operational and commercial use.
Above these devices sits the substation automation system. Its visible part is often a local HMI with a single-line diagram, measurements, alarms and controls. Behind it are gateways, Remote Terminal Units (RTU), event recorders, engineering tools and configuration files. The substation is already a distributed software system, only with unusually expensive outputs.
Communication inside a modern substation is often organised around IEC 61850.
At first, it is tempting to think of IEC 61850 as just another network protocol, similar to HTTP or Modbus. But it is much broader than that. It is a common language for describing the devices, measurements, commands and protection functions inside a power-system automation system.
For example, different vendors may build protection relays in very different ways, but IEC 61850 gives them a shared model for concepts such as circuit breakers, voltage measurements, alarms and trip signals. This makes it easier for devices and engineering tools from different manufacturers to understand each other.
IEC 61850 also defines several ways in which these devices communicate. MMS is commonly used when one system needs to read data from another device, receive reports or send a control command. GOOSE is used for very fast messages between devices, for example when one protection relay must immediately tell another device to trip a breaker. Sampled Values are used to send digitised current and voltage measurements over the station network.
The standard also includes SCL, or Substation Configuration Language. SCL files describe which devices exist in the substation, what data they provide, how they are connected and how they communicate. In other words, IEC 61850 defines not only how messages travel, but also what those messages mean and how the whole system is engineered.
Communication between a substation and a remote control centre often uses another standard called IEC 60870-5-104, usually shortened to IEC 104.
Its role is easier to imagine. A gateway or Remote Terminal Unit inside the substation gathers selected information from local devices and sends it to the control centre. This can include voltage and power measurements, breaker positions, alarms and events. The control centre can then send commands back, for example to open or close a breaker.
A simple mental model is this: IEC 61850 is often used to organise communication inside the substation, while IEC 104 is often used to connect the substation with the control centre.
There are many other protocols, including DNP3, Modbus and OPC UA. There are also decades of legacy equipment and vendor-specific behaviour, because standards can reduce chaos but apparently cannot eliminate human creativity.
At the control centre, SCADA collects telemetry, displays the current state, processes alarms and lets authorised operators issue commands. It is the operational window into the grid.
For transmission operators, SCADA is often surrounded by an Energy Management System, or EMS. The EMS runs applications such as state estimation, power-flow calculation and contingency analysis. State estimation combines measurements with a network model and calculates the most plausible state of the system. Contingency analysis asks what would happen if a line, transformer or generator disappeared.
Distribution operators use similar families of software, often called DMS or ADMS, to supervise distribution networks, manage outages, estimate states and increasingly coordinate distributed generation, batteries and flexible loads.
Around all of this sit historians, alarm systems, disturbance recorders, outage tools, switching-management systems and dispatcher training simulators. Each solves a different problem, but together they perform one purpose: they let humans observe, understand and control a physical system that is far too large and fast to operate directly.
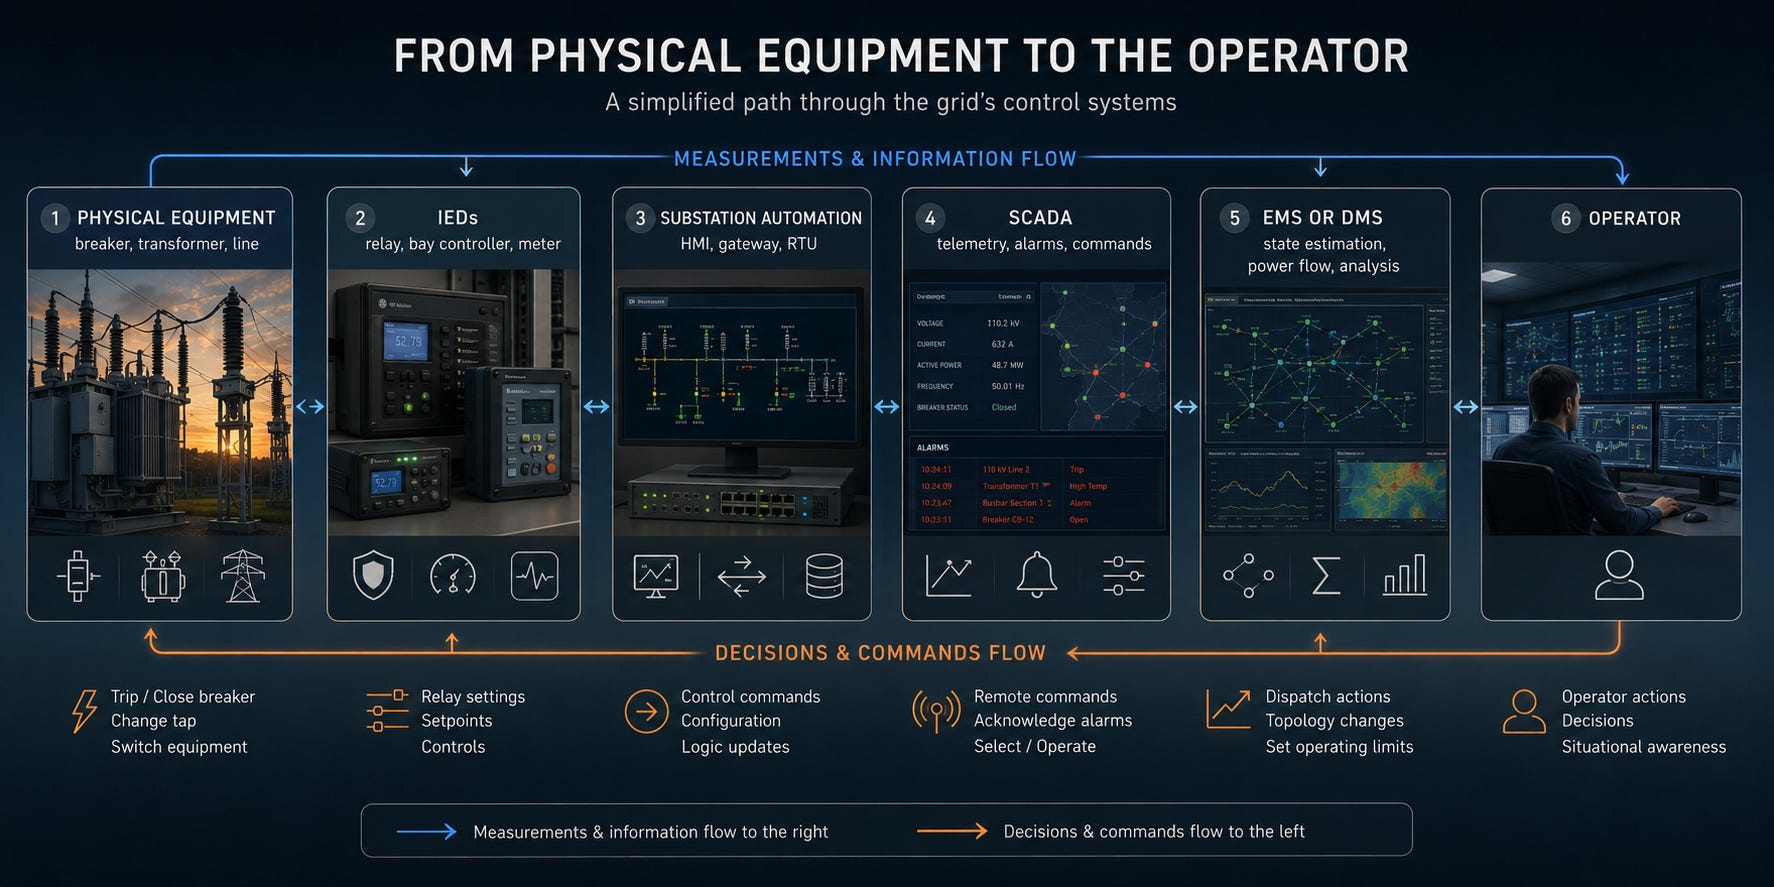
Figure 2. A simplified path from physical equipment to the operator. Measurements travel to the right, while decisions and commands travel back.
Software that operates the electricity market
The market lives in a different world.
It does not normally open breakers or read raw current samples. It works with products, bids, schedules, contracts, positions and money. Still, it cannot completely escape physics, because the product it trades must be generated, transported and consumed at a specific time.
The process usually starts with forecasting and analytics. Generators forecast their available production. Suppliers and balance responsible parties forecast consumption. Traders forecast prices, weather and the behaviour of everybody else who is also forecasting prices, weather and the behaviour of traders. There is a pleasing circularity to the whole exercise.
These forecasts enter trading and bidding systems. Market participants prepare orders for forward, day-ahead, intraday and balancing markets. The software checks limits, builds bidding strategies, submits orders and records the results.
At the exchange side, market systems collect bids and offers. In the European day-ahead and intraday markets, market coupling allocates cross-zonal capacity together with energy orders. The Capacity Allocation and Congestion Management rules define the framework for this process. The algorithm does not simply find a buyer for every seller. It tries to maximise economic surplus while respecting the capacity available between bidding zones.
Once the market clears, the result becomes a schedule. Generators know how much they should produce, suppliers know what they bought, and balance responsible parties have a position that they must later defend against reality.
Large participants commonly use Energy Trading and Risk Management systems, or ETRM. These systems keep track of trades, contracts, portfolios, exposure, nominations, collateral and settlement. They are the commercial memory of the company.
After delivery, metering and settlement systems compare contracted quantities, schedules and measured energy. They calculate invoices, fees and later the cost of imbalances. The market therefore does not end when the price is published. It ends much later, when the final numbers agree enough that money can move.
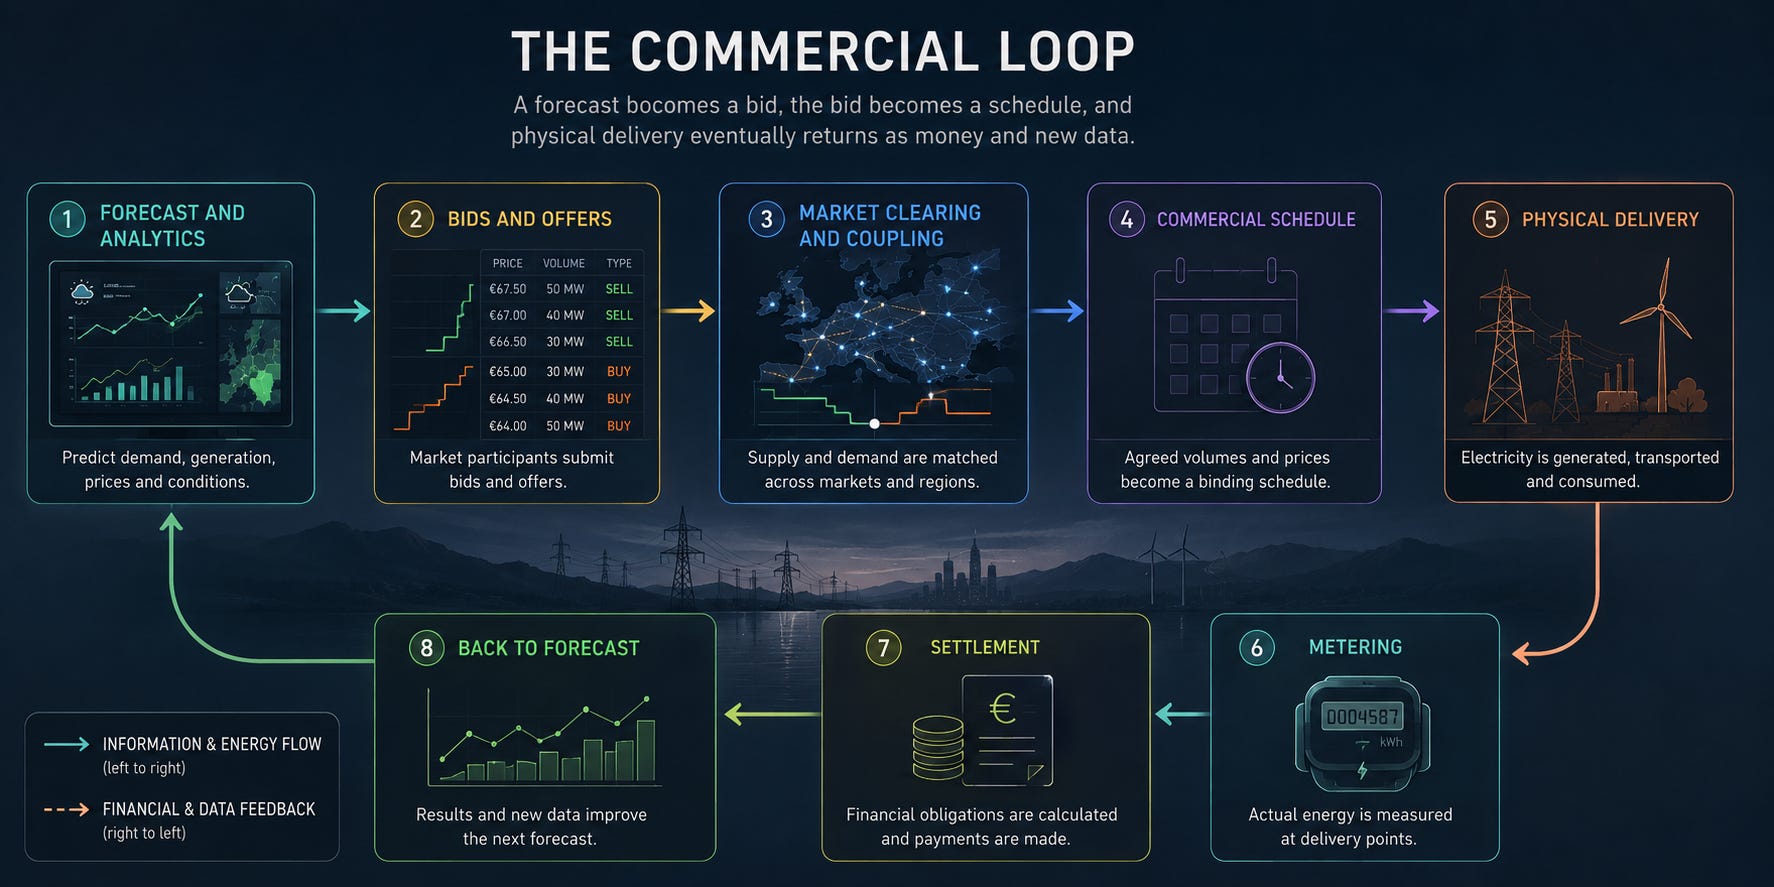
Figure 3. The commercial loop. A forecast becomes a bid, the bid becomes a schedule, and physical delivery eventually returns as money and new data.
Software that connects both worlds
The third area is where the article becomes especially interesting for me.
A market participant can create a good schedule. A control centre can observe the real grid. Neither is enough alone. Somebody must continuously compare the planned world with the physical one and decide what to do when they differ.
This is one of the main software responsibilities of a Transmission System Operator.
A TSO receives schedules, forecasts and availability information from market participants. At the same time, SCADA and EMS show what the system is actually doing. The TSO compares the two realities and checks whether the grid can safely carry the planned flows.
This area contains load and generation forecasting, scheduling systems, network models, capacity-calculation tools, congestion-management tools and operational-security analysis. European TSOs also exchange their individual grid models and combine them into a Common Grid Model through shared infrastructure such as the Operational Planning Data Environment. It is software used not merely by one company, but to construct a common view of an interconnected continent.
When expected flows violate limits, TSOs may use remedial actions such as changing generation, modifying topology, redispatching power or countertrading. When production and consumption diverge in real time, balancing software procures and activates reserves.
Some control happens almost automatically. Frequency Containment Reserves respond quickly to frequency deviations. Automatic and manual Frequency Restoration Reserves bring the system back toward its target. European platforms such as PICASSO for aFRR and MARI for mFRR coordinate the exchange of balancing energy between TSOs.
Afterwards, imbalance-calculation and settlement systems compare the final measured position of each balance responsible party with its schedule. The physical deviation becomes a financial result.
This is the point where the two worlds finally meet. A forecast becomes a bid, a bid becomes a schedule, a schedule becomes a power flow, a power flow becomes a frequency deviation, and the deviation eventually becomes an invoice.
The grid and the market are not separate systems. They are two models of the same reality, connected by a large amount of software and by the stubborn requirement that, in every moment, production and consumption still have to match.
Regulation is part of the architecture
In most software projects, requirements begin with a customer, a product manager or somebody who has discovered a new button they urgently need.
In the grid, a requirement may have started years earlier in an EU regulation.
The chain roughly looks like this:
EU legislation → Network Codes and Guidelines → ACER and national regulators → national laws, tariffs and approved methodologies → company processes and technical requirements → software behaviour, interfaces and audit trails
For system operation, the System Operation Guideline, Regulation (EU) 2017/1485, defines rules around operational security, coordination, data exchange and planning between TSOs, DSOs and significant grid users.
For balancing, the Electricity Balancing Guideline, Regulation (EU) 2017/2195, establishes common principles for procuring, activating and settling reserves.
For day-ahead and intraday markets, the CACM framework defines how capacity calculation and market coupling should work across Europe.
Technical standards sit beside these legal layers. IEC 61850 shapes data models and communication inside utility automation. IEC 104 defines a common telecontrol path. Other standards define cybersecurity, grid-model exchange, metering, testing and many other details that developers eventually meet as requirements.
There is still room for architecture, design and creativity, but not every behaviour is free to invent. A configuration field may exist because a standard requires it. An audit trail may exist because an operator must later prove who issued a command. A market interface may have a strange deadline because an approved methodology defines a gate-closure time.
This was one of the most important discoveries for me. Regulation does not sit somewhere outside the software. It slowly flows down through organisations until it becomes a database field, a validation rule, a protocol message or a test case.
A map, not an encyclopedia
My goal was not to create the full catalogue of all software, protocols and standards used in the grid. That catalogue would be enormous and, more importantly, almost unreadable.
I wanted to draw a mental map that gives you an impression and a raw feeling of what exists, why it exists and where your own software takes its place.
The map has three large regions.
Operation and control software turns physical processes into measurements, alarms, models and commands.
Market software turns forecasts and electricity into bids, schedules, contracts and prices.
Coordination software stands between them and compares the planned world with the real one until they agree, or at least disagree within limits that the grid can survive.
Regulation and standards cover all three. They define many of the roads, borders and languages through which these systems communicate.
This is still not Google Maps. It is closer to Herodotus, with incomplete coastlines and unknown territory beyond the edge. But now, when I meet a new protocol, algorithm or application at work, I at least understand on which part of the continent I have landed.
In the future I want to visit some of these places properly. I would like to rebuild substation communication, follow a signal from a relay to a control centre, reconstruct a market-clearing algorithm, and understand how one planned megawatt becomes an imbalance and finally money.
The next topics will probably be defined by the problems I face in my current position and by questions from people who read this series. That feels like the most honest way to continue the journey.
The next investigation has begun in Networking in the Power Grid for Software Developers. Start with Part 1: Rebuilding a Local Network with Medieval Signal Towers to reconstruct Ethernet, switching, and ARP before following the network toward substations and control centres.
And may the Force be with you.
All parts of the series:
